|
WHAT IS INTERALI Interali is a web based software, which provides purchase and inventory data from Thermo Fisher’s ERP system (Scala) . The data is developed in the form required by the users. Normally such information is needed by Thermo’s purchasers and contract suppliers. Interali offers an opportunity to improve material availability and save costs. This can be achieved by using more efficient processes like Frame Order Process (VMI = Vendor Managed Inventory) and Consignment Stock (VOMI = Vendor Owned and Managed Inventory), which speed up forwarding consumption and forecast data to the suppliers and make easier to order and deliver. Generally this kind of operating principle is called Kanban. There are the following user groups and their access rights:
Interali serves purchasers by
Interali serves suppliers by
|
|
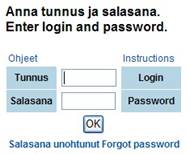
https://vantaa.thermo.com/interali/
Typical email message after resetting: “The new password is:Tza1axax”
|
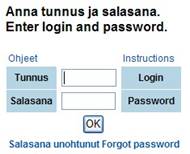
LOGGIN Use the address as in the adjacent picture and login. The login code will be sent by a Thermo’s responsible purchaser. To log out
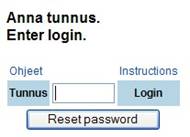
FORGOTTEN PASSWORD If you forget the password, click text Forgot password. Give then your Login code and click Reset password.
After resetting you will receive a temporary password by email.
Enter the login code and the temporary password. |
|
Typical email notification of a new password: “The new password is: Neword10”
|
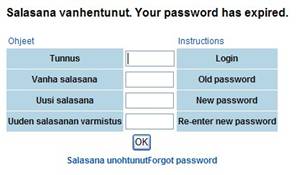
UPDATING NEW PASSWORD Enter the temporary login code as an old password and give a new password.
The new password will be sent by email to each person using the same login code. NOTE! Please inform Thermo’s responsible purchaser about any changes of user name or email addresses. |
|
|
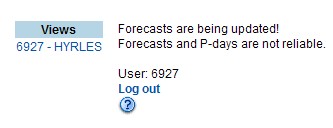
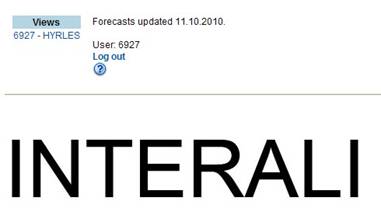
UPDATING CONSUMPTION FORECASTS Normally the forecasts will be updated weekly (usually on Thursdays). When this takes place, the older forecasts are being updated and then you can see zero values. Anyway you will be warned off using data. |
PAGE 8 – PURCHASER’S DEFAULT VIEW AND/OR SUPPLIER’S VIEW
|
|
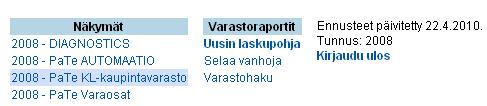
STARTING DISPLAY – SUPPLIER Select a supplier view by clicking the text. |
|
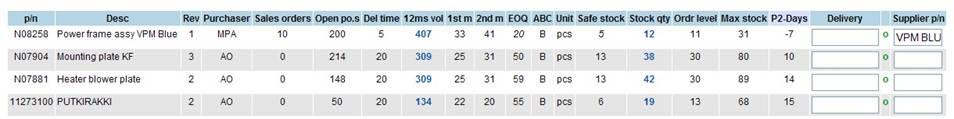
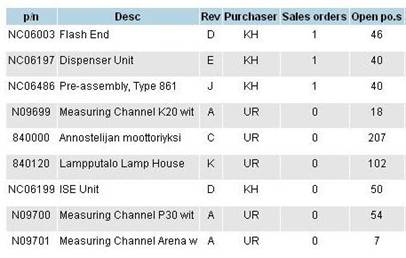
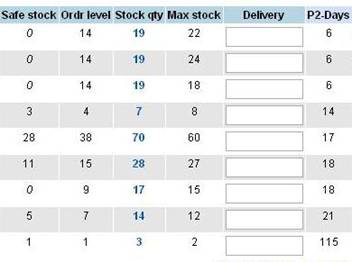
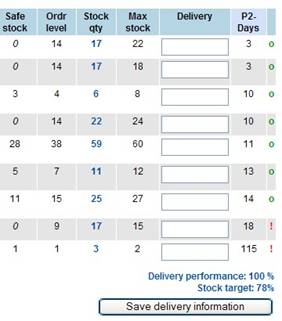
SUPPLIER VIEW A typical supplier view looks like this. Both Thermo’s purchaser and the supplier can see that. The contents can be adjusted according to the needs and it shows the data in real time. The column names have been abbreviated for saving space on the screen and paper. To get help for interpreting, just point the column names with the cursor. The rows are printed in the default order, but you can change it by clicking any column name. The rows will always printed out in the alphabetical or increasing number order. You can change certain manual values, which you find in the frames. |
|
|
|
|
OTHER VIEWS / SUPPLIER PAGE Some other links shown on the top of the screen refer to unother supplier or inventory views. Just click a selection name to see data. |
|
|
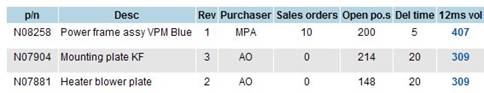
GENERAL INFORMATION OF MATERIAL NEEDS Column Sales orders tells the existing and immediate need coming from sales and production orders. Column Open po.s sums up the ordered quantities of the existing and open purchase orders. Column 12ms vol includes annual consumption forecasts. |
|
|
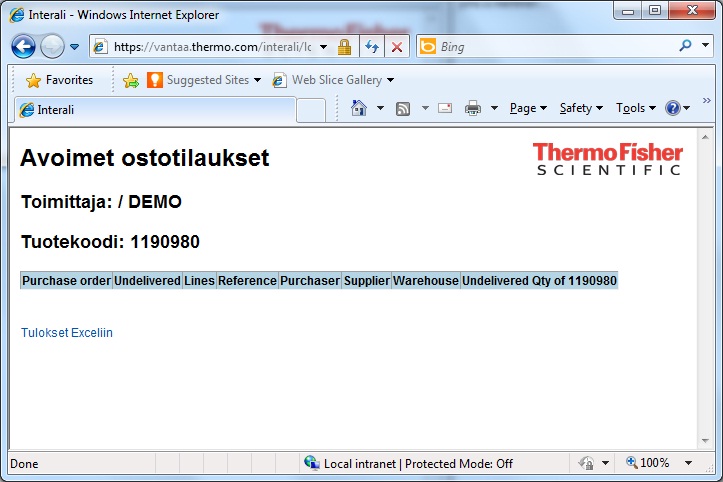
SUPPLIERS OPEN PURCHASE ORDERS Suppliers open purchase orders will be displayed by clicking Open po.s sums.
|
|
|
HOW TO OPERATE BASED ON ORDERING INFORMATION Sales and production orders The sales orders require immediate material deliveries (for example spare parts or their components). The production orders means a special case, where the production prepares things for starting manufacturing. These two needs are summed on column Sales orders (pcs). This quantity should be delivered as soon as possible, if there are open purchase orders. Open purchase orders This column tells the sum of the ordered items coming from one or several purchase orders. This means a permission to deliver materials, when there is a supply contract. The materials will be delivered in lots by following Frame Order or Consignment Stock process. When Open po.s = 0, do not deliver and do not prepare deliveries. |
|
|
SUPPLIER’S MATERIAL DELIVERIES The materials will be delivered by following a restocking (fulfilling) principle. That is based on the contracted process (Frame Order or Consignment Stock process) and it is brielfy as follows:
NOTE: IF THE QUANTITY IS BELOW THE SAFETY LEVEL AND THERE IS NO DELIVERY ANNOUNCEMENT, THE INTERALI SENDS A REMARK BY EMAIL.
|
|
|
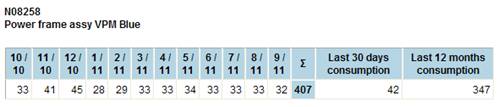
CONSUMPTION FORECAST Click an annual forecast value on column 12ms vol (12 months’ volume) of the supplier view in order to print out the monthly values. The numbers describe an avarage consumption and they will be updated in “rolling way” regularly. Every supplier view will be saved once a day and is available in 18 months in maximum. |
|
|
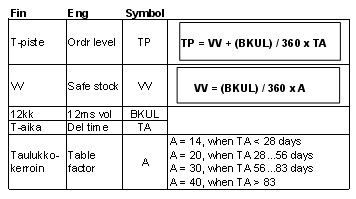
DUE TIME One of the most important factors for controling the Frame Order Process and adjusting stock level is the due time. So it is recommended that a supplier and Thermo together check and define a realistic due time for each item. The due time affects directly the Safe stock, Order level, and Max stock levels. Any unrealistic due time may generate delivery problems and excessive costs: too a short one likely causes material shortages and too a long one overstocking. |
|
|
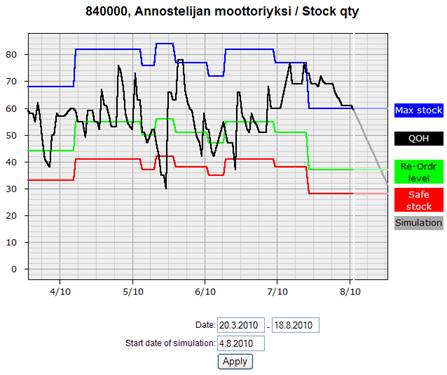
DETAILED STOCK VIEW FOR SUPPLIERS Click a number on column Stock qty in order to see a detailed curve diagram. It shows a trend of a quantity (QOH = stock qty in history) in last 30 days. If necessary, you can change the interval and even simulate the future, see the right-hand side beyond the vertical white line. Correspondingly you can see the trends of a Safe stock, Order level, and Max stock. |
|
|
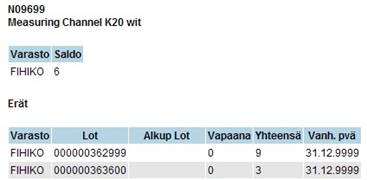
STOCK VIEW FOR PURCHASERS Click a number on column Stock qty in order to see a detailed list of stocks and received lots.
|
|
|
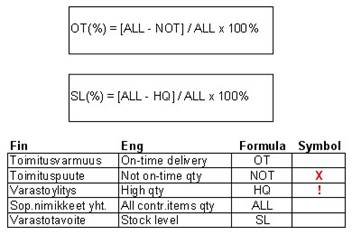
SUPPLIER PERFORMANCE Suppliers’ performance will be followed by measuring how the on-time deliveries and stock levels have been realized per each contract item. Accepted status will be displayed by: O = Stock qty is between Safe stock and Max stock.
Defect status will be displayed by: X = Stock qty is lower than Safe stock ! = Stock qty is higher than Max stock
The metrics concerns also the other items than contract ones but then the symbols are black. These measurements will not be used for following performance. |
|
|
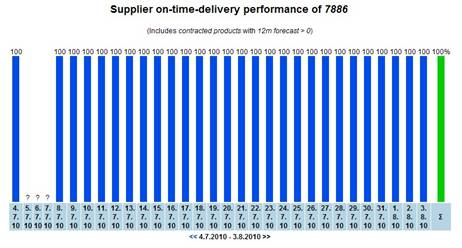
ON-TIME DELIVERIES The measurements of each contract item are saved daily. Click text link Delivery performance to show history of last 30 days. The average value should be better than 98%. If needed, you can browse measurements in the desired period. |
|
|
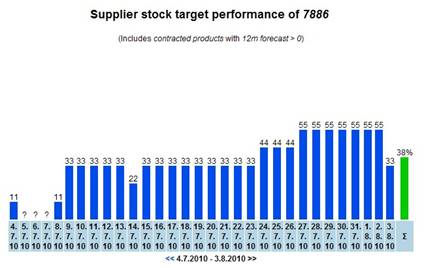
STOCK LEVELS The measurements of each contract item are saved daily. Click text link Stock target to show history of last 30 days. If needed, you can browse measurements in the desired period.
PERFORMANCE METRICS The adjacent formulas reveal the principle, how the Delivery performance and Stock target are being measured daily.
|